How V8 Runs - V8's JavaScript Execution Pipeline 2021
This article was tested against V8 v9.5.172.
Nearly two years have passed since my previous V8 article. Over that time, I’ve been glad to see more and more V8 content appearing in the Chinese community. The one regret is that some long-standing, as well as some newer, material still hasn’t made it into the Chinese community. This article is a major restructure and update of the 2019 piece, aiming to bring you content that is as new and comprehensive as possible. Happy reading~
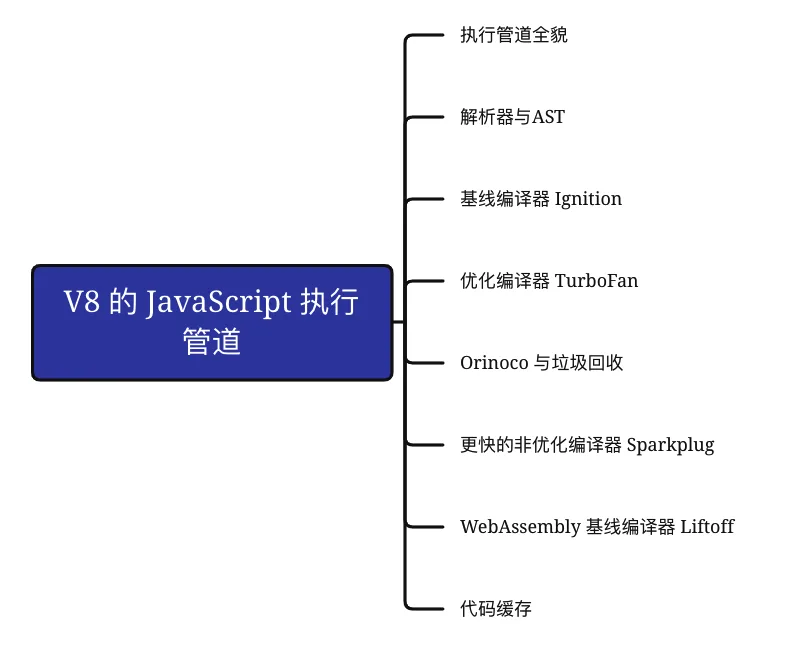
1. Preparation Before Reading
Before reading, I recommend getting d8 ready — it’s V8’s developer command-line tool, and this article includes some experiments based on d8.
I recommend reading Building V8 with GN: download the source and build V8 (note that you need to specify debug mode when building), and you’ll be able to run every experiment in this article.
gm x64.debug # 指定构建为 debug 模式You can also download directly an out-of-the-box d8 build, which covers the vast majority of the experiments in this article.
2. About V8
V8 is a high-performance JavaScript and WebAssembly engine written in C++. It supports ten processor architectures, including the ones we know well: ia32, x64, and arm. In the browser, it powers Chrome and the many Chromium-based browsers; on the server, it’s the execution environment for Node.js and Deno.
Release Cycle
- Roughly every four weeks a new V8 version comes out (four weeks for V8 v9.5 and later; six weeks before that)
- V8 versions map to Chrome versions; for example, V8 v9.5 corresponds to Chrome 95
Standalone Core Modules
- Ignition (baseline compiler)
- Sparkplug (a non-optimizing compiler faster than Ignition)
- TurboFan (optimizing compiler)
- Liftoff (WebAssembly baseline compiler)
- Orinoco (garbage collector)
Other JavaScript Engines
- Chakra (the former Edge JavaScript engine)
- JavaScriptCore (Safari)
- SpiderMonkey (Firefox)
The figure below compares the compiler pipelines of V8 and the other JavaScript engines.
 Image source - Javascript Engines: The Good Parts
The compiler pipelines of the different JavaScript engines are broadly similar. In V8, the parser turns JavaScript source code into an AST, and the baseline compiler compiles the AST into bytecode. Later, once certain conditions are met, the bytecode is compiled by the optimizing compiler into optimized machine code.
3. Overview of the Execution Pipeline
JavaScript execution can be simplified to “compile - execute - garbage collect”. In this article we’ll focus on compilation and garbage collection, with most of the space devoted to the compiler (pipeline).
The figure below shows how the V8 compiler pipeline architecture has evolved.
 Image source - TurboFan: A new code generation architecture for V8
Early V8 had only one compiler, Codegen, which compiled the AST produced by the parser directly into machine code. Execution was fast, but optimization was limited.
Two years later, a new compiler pipeline appeared, built from the baseline compiler Full-Codegen and the optimizing compiler Crankshaft. The baseline compiler focused on compilation speed, while the optimizing compiler focused on the execution speed of the compiled code. Using the two together gave JavaScript code a faster cold start and, once optimized, faster execution.
Although V8 now had separate baseline and optimizing compilers, this architecture still had many problems. For example, Crankshaft could only optimize a subset of JavaScript; there was little isolation between the layers of the compilation pipeline, and in some cases assembly code even had to be written for several processor architectures at once, among other things.
So V8 introduced another optimizing compiler, TurboFan, building on Crankshaft. With its layered design, TurboFan lowered the cost of adapting to processor architectures and could optimize ES6 while staying forward-compatible with more future features.
But by this point the baseline compiler Full-Codegen was generating unoptimized machine code that took up about 30% of V8’s heap space — even code that only ran once was never released — which was costly in terms of memory.
So V8 introduced bytecode and built a corresponding baseline compiler, Ignition. Compared with machine code, bytecode is simpler and more compact, so it consumes less memory — about 50% to 25% of equivalent baseline machine code. At the same time, Ignition’s bytecode can be used directly by TurboFan to generate optimized machine code, the deoptimization machinery was simplified, and the overall architecture became clearer and easier to maintain. And because bytecode is generated faster than optimized machine code, Ignition can also shorten a script’s cold-start time, which in turn speeds up page loading.
In May 2017, V8 v5.9 officially enabled by default the JavaScript compiler pipeline made up of the baseline compiler Ignition and the optimizing compiler TurboFan, and removed the earlier Crankshaft and Full-Codegen compilers.
In August 2018, V8 v6.9 shipped Liftoff, marking the point at which V8 began supporting both JavaScript and WebAssembly.
In May 2021, V8 v9.1 shipped the non-optimizing compiler Sparkplug, used to get faster execution before the optimizing compiler produces optimized code.
In what follows, we’ll walk through one piece of code and analyze how JavaScript is processed in V8.
function addTwo(a, b) {
  return a + b
}
4. The Parser and the AST
Once V8 gets the JavaScript code, the first thing it does is parse it; the process is shown below.
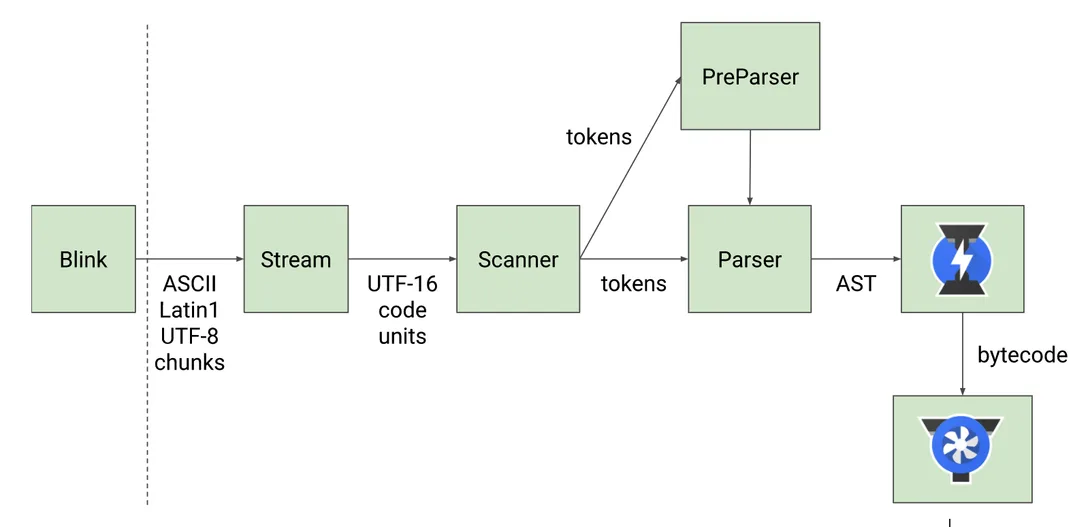 Image source - Blazingly fast parsing, part 1: optimizing the scanner
Tokens are produced by the Scanner through tokenization and consumed by the Parser, which processes them into an AST (Abstract Syntax Tree). The AST describes the structure of the program and is consumed by the baseline compiler Ignition to produce bytecode.
Because parsing takes time, JavaScript engines avoid fully parsing source code whenever possible. On top of that, in any single user visit plenty of the page’s code never executes — for example, actions triggered by user interaction.
To save unnecessary CPU and memory overhead, all major browsers implement lazy parsing. Instead of having to build an AST for every function, the parser can decide to “pre-parse” or “fully parse” the functions it encounters.
Pre-parsing checks the source code’s syntax and throws syntax errors, but doesn’t resolve the scopes of variables inside the function or produce an AST. Full parsing analyzes the function body and generates the AST data structure for the source code.
If you’re interested in lazy parsing, you can read the related V8 article.
We can look at a piece of code’s AST information with d8. (Note: this only works with a debug-mode d8; release mode doesn’t support the –print-ast flag.)
// example.js
function addTwo(a, b) {
  return a + b;
}
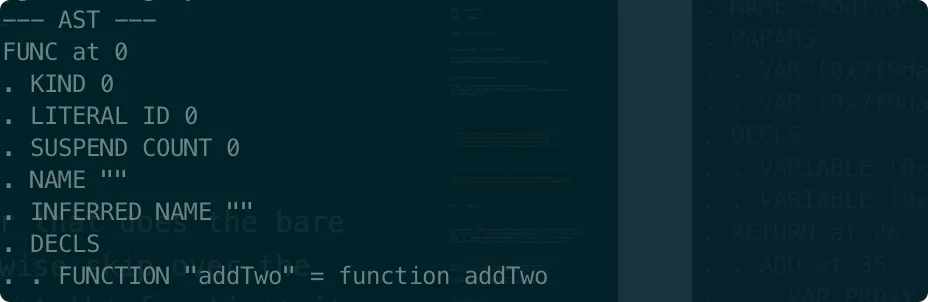
d8 --print-ast example.jsThe output is shown below. Notice that it contains no AST structure for the addTwo function, because the code hit lazy parsing.
 Let’s change the code to the following, adding one function call, and run the d8 command again.
// example.js
function addTwo(a, b) {
  return a + b;
}
addTwo(1, 2);
The output is shown below.
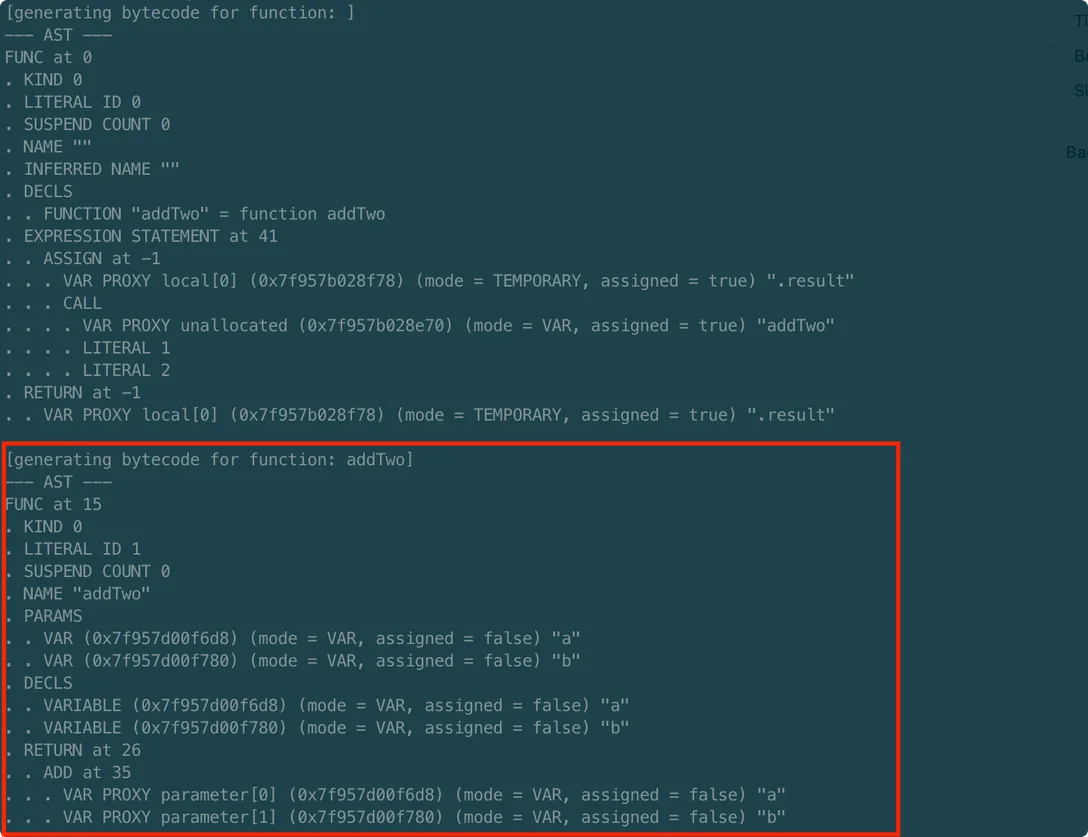
From addTwo’s AST information, we can draw the tree below. One subtree is for the parameter declarations, the other for the actual function body.
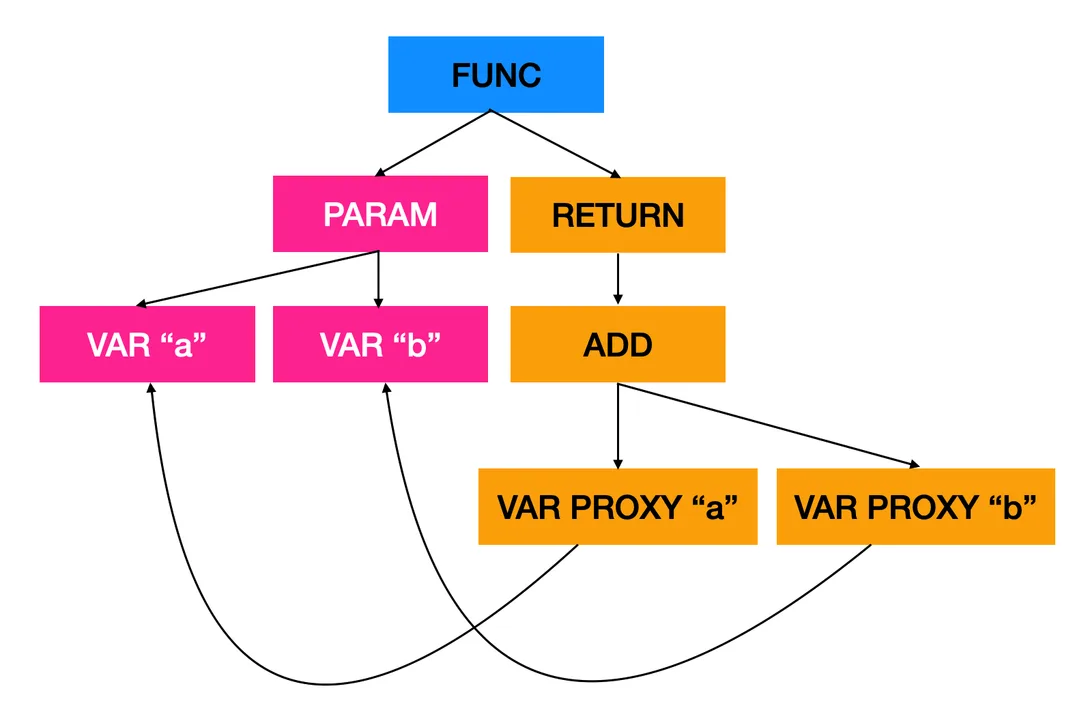
Because of hoisting, eval, and similar features, it’s impossible to know during parsing which names correspond to which variables in the program, so the parser initially creates VAR PROXY nodes. A later scope-resolution step connects these VAR PROXY nodes to declared VAR nodes, or marks them as global or dynamic lookups, depending on whether the parser saw an eval expression somewhere in the enclosing scopes.
Note that V8’s AST differs somewhat from the eslint/babel/ts ASTs that AST Explorer produces; I also covered this in the previous version of this article.
5. Ignition, the Baseline Compiler
V8 brings in JIT (Just In Time) compilation, using the Ignition baseline compiler to quickly generate bytecode and execute it.
Bytecode is an abstraction of machine code and is independent of the system architecture. V8’s bytecode can be seen as small building blocks that combine to implement arbitrary JavaScript functionality. By introducing bytecode, V8 reduced memory usage and parsing overhead while also lowering compilation complexity.
In V8, generating bytecode from the AST is implemented by Ignition. Ignition is a register-based interpreter with an accumulator. These registers aren’t physical registers — they’re a virtual implementation.
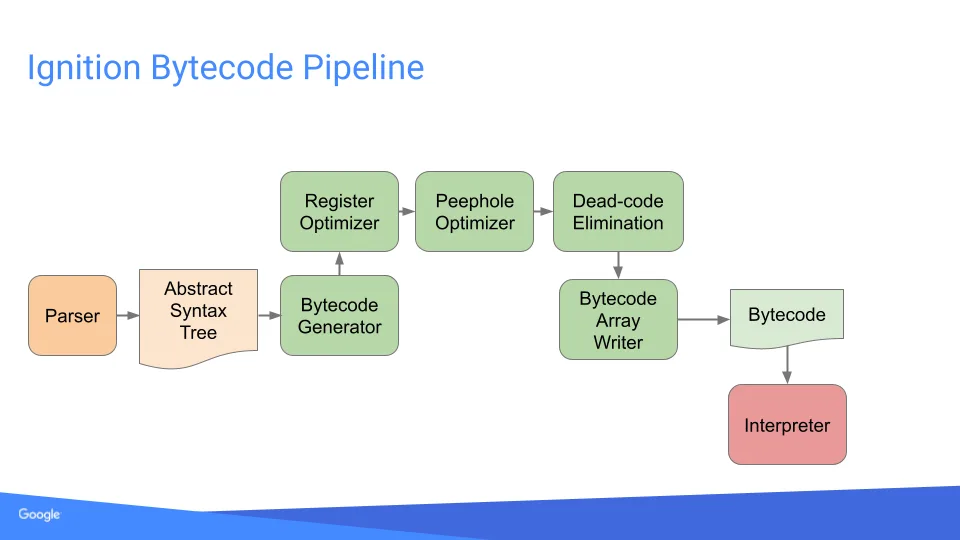 Image source - Ignition: Jump-starting an Interpreter for V8
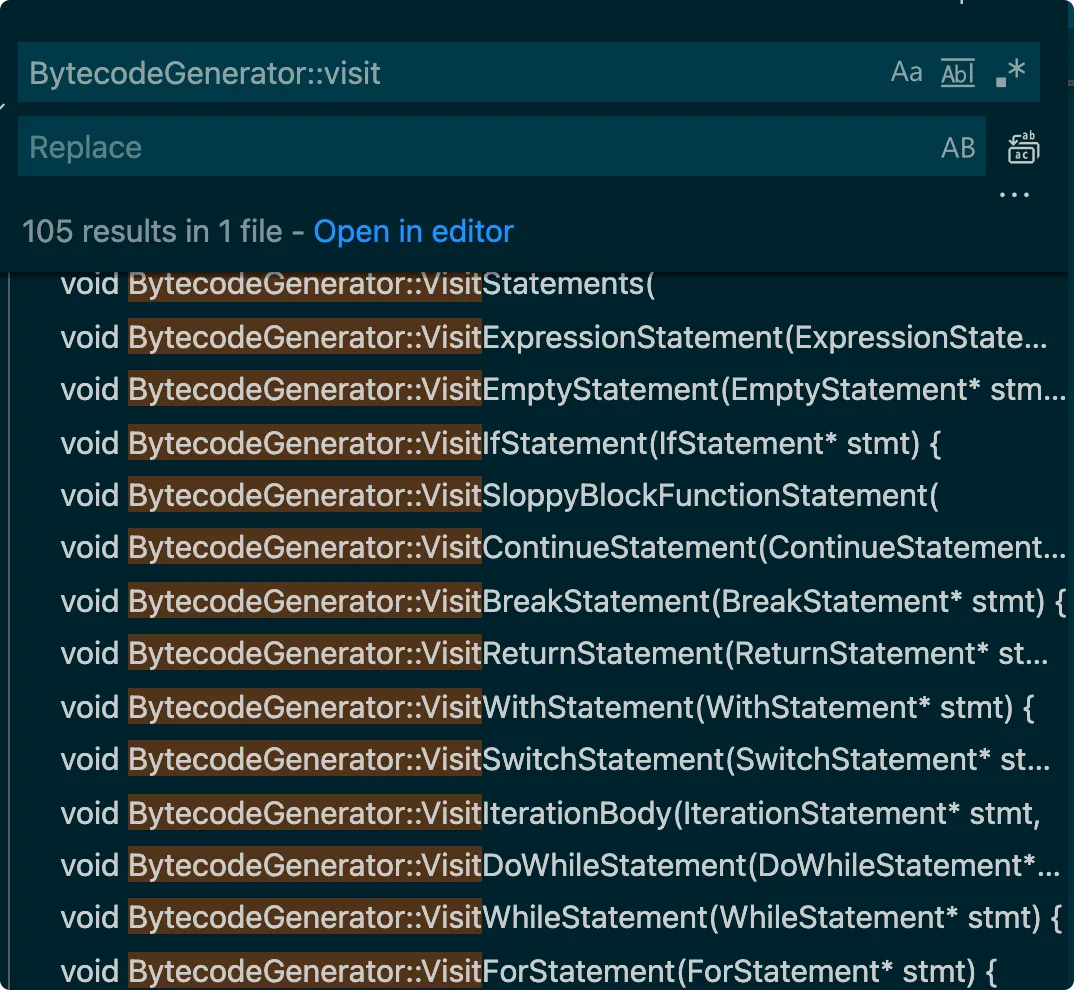
The Ignition bytecode pipeline is shown above. JavaScript code is converted into bytecode by the BytecodeGenerator, an AST visitor that implements different bytecode-generation rules for the different AST node types, as shown below.
After this, Ignition applies a series of optimizations to the bytecode. The Register Optimizer optimizes away unnecessary register loads and stores; the Peephole Optimizer rewrites groups of instructions into equivalent instructions with better performance; and Dead-code Elimination removes code that can never be reached.
With a d8 command we can get a function’s bytecode, shown below.
d8 --print-bytecode example.js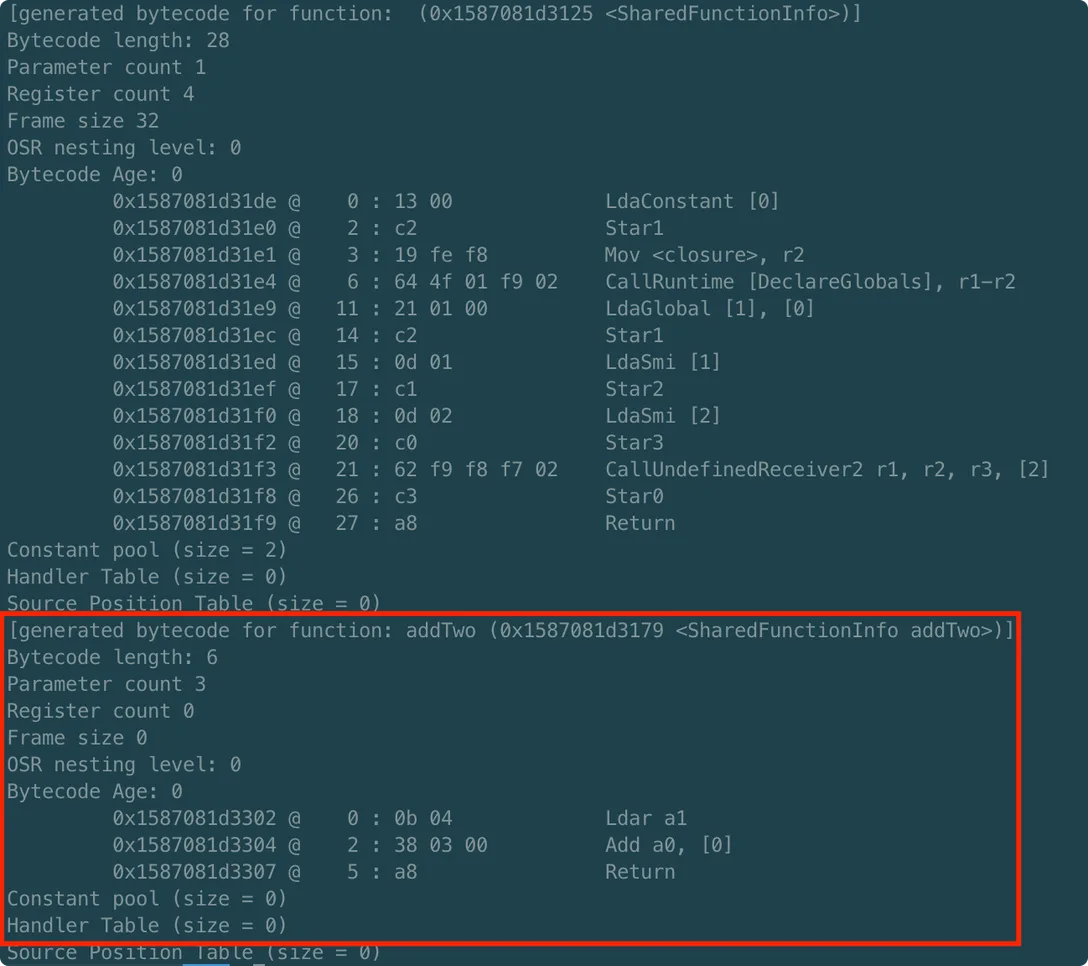
When we call addTwo(1,2), the small integers 1 and 2 have already been loaded into the a0 and a1 registers via LdaSmi. Ldar a1 loads 2 into the accumulator; then Add a0, [0] adds the value in the accumulator to the value in a0, and the accumulator now holds the new value — 3; finally, Return returns the value in the accumulator.
 Note the
Add a0, [0] — the [0] here is an index into the feedback vector. Profiling information gathered while the bytecode is interpreted is kept in the feedback vector, and the feedback vector will supply optimization information to the optimizing compiler TurboFan later on.
Ignition’s commonly used bytecodes are shown below; all bytecodes can be found in the V8 source code, so feel free to take a look.
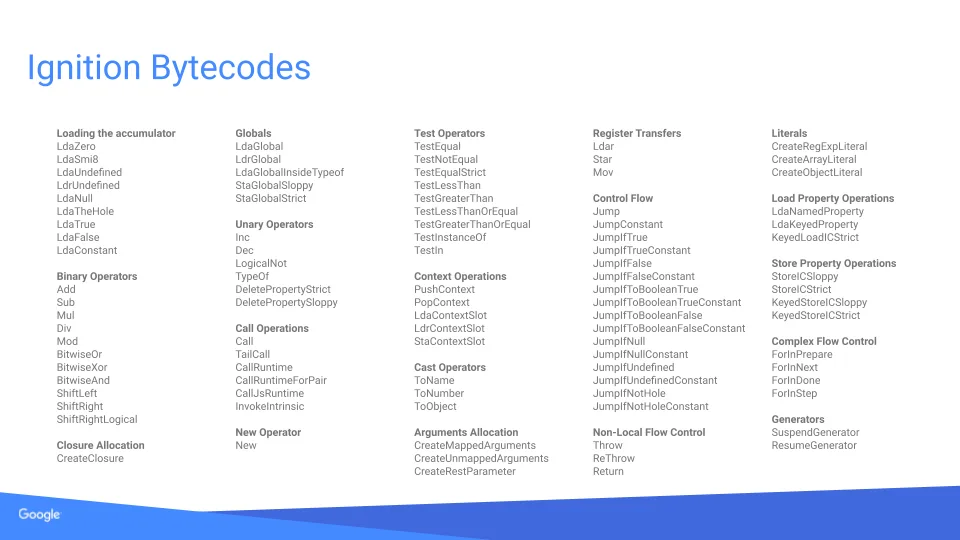 Image source - Ignition: Jump-starting an Interpreter for V8
In real-world use, the V8 team found that many functions only run during application initialization, yet their bytecode stays in V8’s heap space forever. To reduce V8’s memory overhead, V8 v7.4 introduced bytecode flushing. V8 tracks how functions are used: every garbage collection increments a function’s counter, and executing the function resets the counter to zero; when the counter exceeds a threshold, the memory gets reclaimed.
6. TurboFan, the Optimizing Compiler
The more general the code, the worse it performs; conversely, the fewer variations in function types a compiler has to account for, the smaller and faster the code it generates.
As everyone knows, JavaScript is a weakly typed language. The ECMAScript standard involves a great deal of ambiguity and type checking, so the code generated by the baseline compiler Ignition isn’t efficient enough.
For example, the operands of the + operator can be integers, floats, strings, booleans, and other reference types — and they can be combined with one another in all sorts of ways.
function addTwo(a, b) {
  return a + b;
}
addTwo(2, 3); // 3
addTwo(8.6, 2.2); // 10.8
addTwo('hello ', 'world'); // "hello world"
addTwo('true or ', false); // "true or false"
// 还有很多组合...
But that doesn’t mean JavaScript code can’t be optimized. For specific program logic, the types of the arguments it receives are usually fixed. So V8’s optimizing compiler TurboFan collects type feedback at runtime through inline caches and compiles hot code into more efficient machine code.
For space reasons, I won’t expand on inline caches here. I’d happily recommend JavaScript Engine Fundamentals: Shapes and Inline Caches, translated by @hijiangtao on Zhihu; if you’re interested, you can also read my other article, How V8 Runs — Object Representation in V8.
To verify the optimization process, let’s change the test code to:
// example.js
function addTwo(a, b) {
return a + b;
}
for (let j = 0; j < 100000; j++) {
if (j < 80000) {
addTwo(10, 10);
} else {
addTwo('hello', 'world');
}
}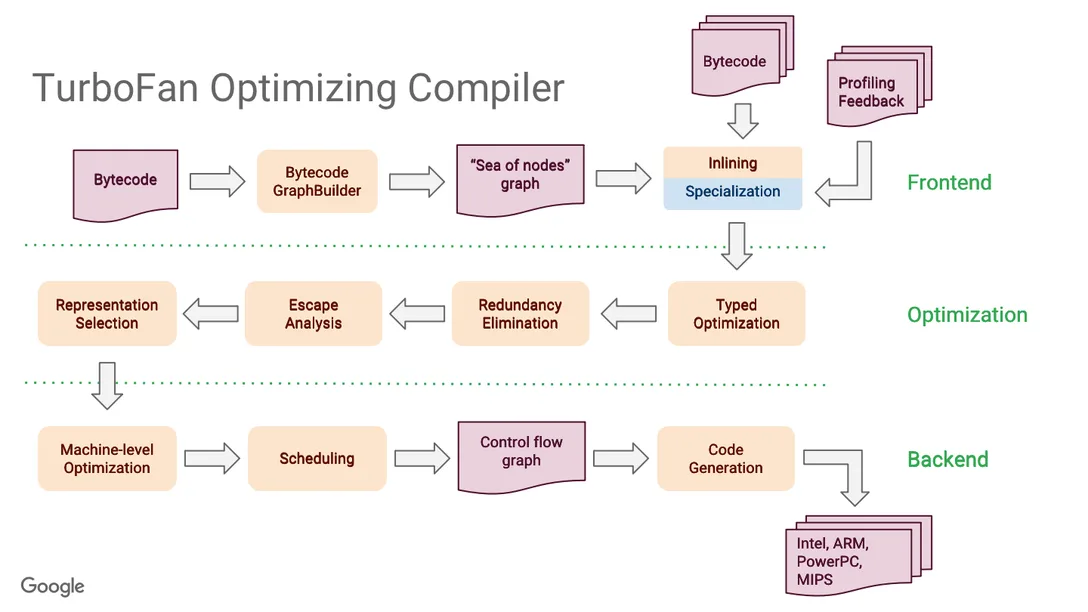 Image source - A Tale Of TurboFan
TurboFan’s pipeline is shown above. Code generation relies on a graph-based IR (Intermediate Representation) called the “Sea of nodes”, a graph that combines control flow and data flow.
d8 also provides tooling to view the Sea of nodes graph. First we need to run our script with the --trace-turbo flag.
d8 --trace-turbo example.jsAfter it runs, a turbo.cfg file and a turbo-xxx-xx.json file appear in the current directory. At this point we can use V8’s online tools to view the Sea of nodes graph visually.
Open the link above, find the Turbolizer tool for V8 v9.5, and import the json file generated in the previous step; you’ll then see the Sea of nodes graph in the browser.
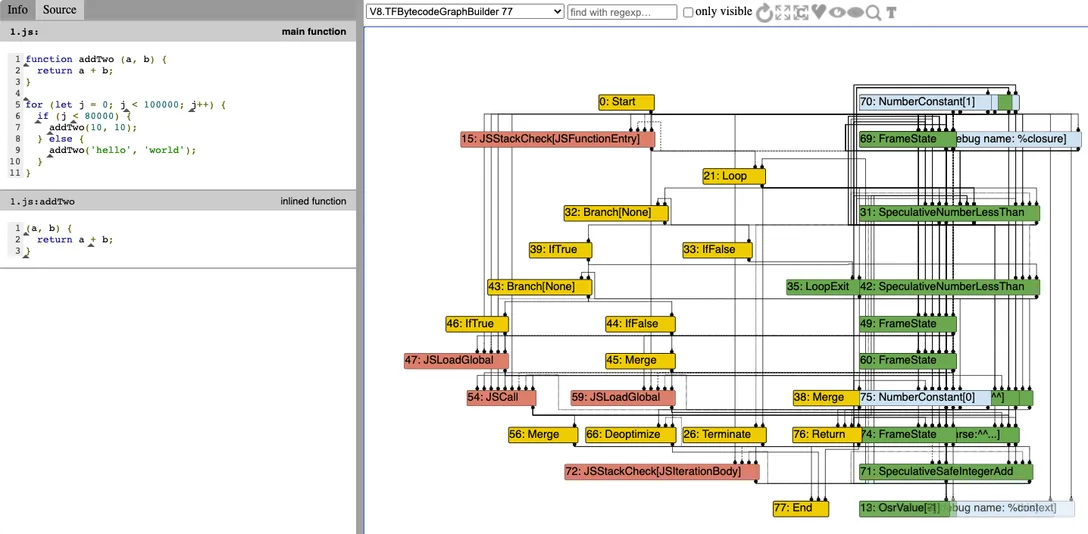
The bytecode is converted into intermediate code by TurboFan’s compiler frontend and, after steps such as optimization, instruction selection, instruction scheduling, register allocation, assembly, and disassembly, the compiler backend produces the final machine code. For register allocation, TurboFan went with linear scan, which performs better than graph coloring.
Next, let’s dig deeper into TurboFan’s IR, the compiler’s code optimization techniques, and the optimization and deoptimization of hot code.
TurboFan IR
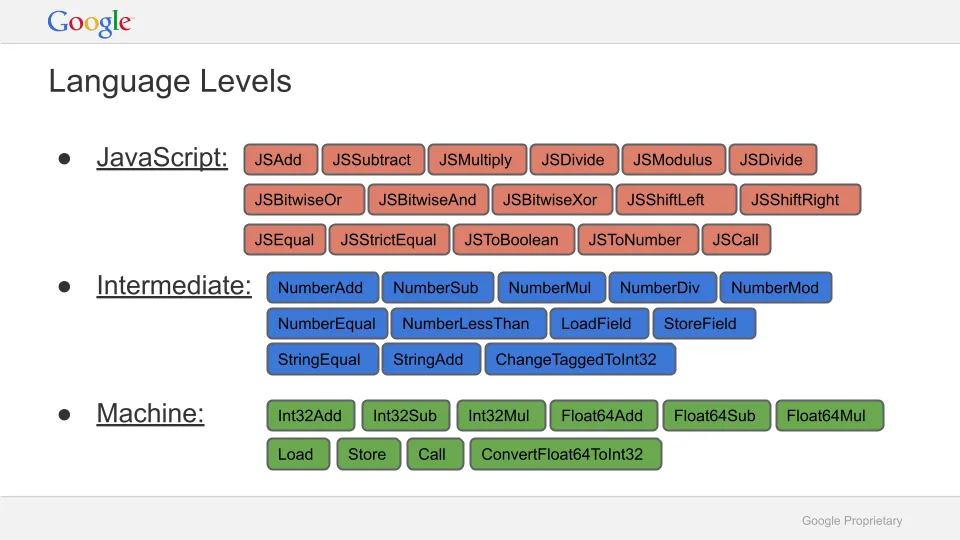 Image source - TurboFan JIT Design
TurboFan introduces a tiered compiler design: with a layered IR — a JavaScript layer, an Intermediate layer (called the Simple layer in some V8 documentation), and a Machine layer — it achieves a clean separation between high-level and low-level compiler optimizations.
In TurboFan, the architecture-specific part is the Machine layer of the IR, which corresponds to TurboFan’s backend. Architecture-specific code only has to be written once, which effectively improves the system’s extensibility and reduces both the coupling between related modules and the complexity of the system.
A diagram of the layering:
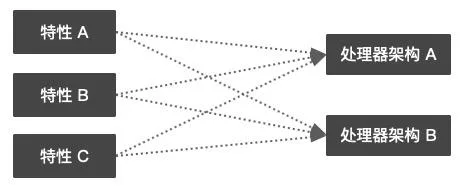
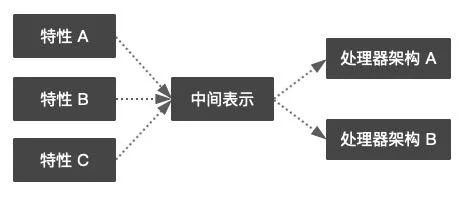
For example, say three features, A, B, and C, need to be ported to two processor platforms. Before introducing an IR, that takes 3 * 2 = 6 code implementations; after introducing the IR, it takes 3 + 2 = 5. One relationship is multiplicative, the other additive. When you need to implement many features and support many processor architectures, the advantage of introducing an IR grows enormously.
The Compiler’s Code Optimization Techniques
Inlining
Inlining expands small functions at their call sites, saving the overhead of function calls — especially for frequently called functions.
// https://docs.google.com/presentation/d/1UXR1H2elTdAYJJ0Eed7lUctCVUserav9sAYSidxp8YE/edit#slide=id.g284582328f_0_43
function add(x, y) {
  return x + y;
}

function three() {
  return add(1, 2);
}
For example, after inlining, the functions above can become the following function:
function three_add_inlined() {
  var x = 1;
  var y = 2;
  var add_return_value = x + y;
  return add_return_value;
}
Inlining not only cuts function overhead; it also makes many more optimization passes efficient, such as constant folding, strength reduction, redundancy elimination, escape analysis, and scalar replacement.
For instance, through constant folding, the function above can be further optimized into:
function three_add_const_folder() {
  return 3;
}
Escape Analysis and Scalar Replacement
Escape analysis determines whether an object’s lifetime is confined to the current function, and can be used to decide whether scalar replacement is possible.
// https://docs.google.com/presentation/d/1UXR1H2elTdAYJJ0Eed7lUctCVUserav9sAYSidxp8YE/edit#slide=id.g2957a3ab8f_0_292
class Point {
  constructor(x, y) {
    this.x = x;
    this.y = y;
  }
  distance(that) {
    return Math.abs(this.x - that.x) + Math.abs(this.y - that.y);
  }
}
function manhattan(x1, y1, x2, y2) {
  const a = new Point(x1, y1);
  const b = new Point(x2, y2);
  return a.distance(b);
}
With inlining, the function above can be transformed into:
function manhattan_inl(x1, y1, x2, y2) {
  const a = { x: x1, y: y1 };
  const b = { x: x2, y: y2 };
  return Math.abs(a.x - b.x) + Math.abs(a.y - b.y);
}
Escape analysis shows that a and b only live within manhattan_inl, so the function can be optimized with scalar replacement into:
function manhattan_ea(x1, y1, x2, y2) {
  var a_x = x1;
  var a_y = y1;
  var b_x = x2;
  var b_y = y2;
  return Math.abs(a_x - b_x) + Math.abs(a_y - b_y);
}
Scalar replacement cuts unnecessary object property-access overhead by turning property accesses into cheaper plain-variable accesses. It speeds up execution while also reducing pressure on garbage collection.
Optimization and Deoptimization of Hot Code
Note: the optimization covered in this section isn’t directly related to the optimizations in the previous section — here we’re talking about whether hot code gets optimized as a whole, not about how any particular implementation is optimized.
For repeatedly executed code, if several executions in a row pass arguments of the same types, V8 will assume that every later execution passes the same types too, and will optimize the code. The optimized code keeps basic type checks in place; as long as the argument types don’t change in later executions, V8 keeps running the optimized code.
If the optimized code no longer satisfies its assumptions, the optimized code can’t run, and V8 will “undo” the earlier optimization — a step called “deoptimization”. The next round of type feedback takes this unexpected result into account and describes types more generically.
In d8, output about the optimization and deoptimization processes can be controlled with the --trace-opt and --trace-deopt flags respectively.
// example.js
function addTwo(a, b) {
  return a + b;
}

for (let j = 0; j < 100000; j++) {
  if (j < 80000) {
    addTwo(10, 10);
  } else {
    addTwo('hello', 'world');
  }
}
d8 --trace-opt --trace-deopt example.js[marking 0x0d4e08293421 <JSFunction (sfi = 0xd4e08293291)> for optimized recompilation, reason: hot and stable]
[compiling method 0x0d4e08293421 <JSFunction (sfi = 0xd4e08293291)> (target TURBOFAN) using TurboFan OSR]
[optimizing 0x0d4e08293421 <JSFunction (sfi = 0xd4e08293291)> (target TURBOFAN) - took 5.114, 11.420, 0.371 ms]
[bailout (kind: deopt-soft, reason: Insufficient type feedback for call): begin. deoptimizing 0x0d4e08293421 <JSFunction (sfi = 0xd4e08293291)>, opt id 0, node id 66, bytecode offset 65, deopt exit 2, FP to SP delta 96, caller SP 0x7ffeec6d2528, pc 0x0d4e0090536e]
[marking 0x0d4e08293465 <JSFunction addTwo (sfi = 0xd4e082932e9)> for optimized recompilation, reason: small function]
[compiling method 0x0d4e08293465 <JSFunction addTwo (sfi = 0xd4e082932e9)> (target TURBOFAN) using TurboFan]
[optimizing 0x0d4e08293465 <JSFunction addTwo (sfi = 0xd4e082932e9)> (target TURBOFAN) - took 1.320, 3.947, 0.207 ms]
[completed optimizing 0x0d4e08293465 <JSFunction addTwo (sfi = 0xd4e082932e9)> (target TURBOFAN)]
[marking 0x0d4e08293421 <JSFunction (sfi = 0xd4e08293291)> for optimized recompilation, reason: hot and stable]
[compiling method 0x0d4e08293421 <JSFunction (sfi = 0xd4e08293291)> (target TURBOFAN) using TurboFan OSR]
[optimizing 0x0d4e08293421 <JSFunction (sfi = 0xd4e08293291)> (target TURBOFAN) - took 4.136, 12.252, 0.400 ms]In this code we performed the + operation 100,000 times: the first 80,000 added two integers, and the last 20,000 added two strings.
By tracing V8’s optimization log, we can see in line 4 of the output that line 10 of the code (the 80,001st execution) triggered a deopt because the argument types changed from integers to strings. And once the new code becomes hot again, the code gets re-optimized.
When deoptimizing, V8 iterates over all optimized JavaScript functions and unlinks each function’s links to its optimized and deoptimized code objects. Large, heavily optimized JavaScript functions become performance bottlenecks. Although V8 handles some deoptimization steps lazily (lazy deoptimization), deopts are still fairly expensive; when writing functions in practice, you should try to avoid triggering them.
The Pain of Optimization
TurboFan’s optimizations bring big performance wins, but the actual optimization process depends on type feedback, and its logic is highly complex and uncontrolled, which makes it very prone to all kinds of vulnerabilities and bugs.
In a real production environment, our team once hit a problem — after a user had a page open for a while, the service’s polling URL turned into a different value. LeuisKen on our team investigated and found that this bug reproduces reliably on v8 v6.7.
A reproducible snippet is below (sanitized):
var i = 'abcdefg';
var n = 'comments';
var t = 'article';

for (let j = 0; j < 10000; j++) {
  var o = '/api/v1/'.concat(t, '/').concat(n, '?commentId=').concat(i);
  if (j % 1000 === 0) {
    console.log(o);
  }
}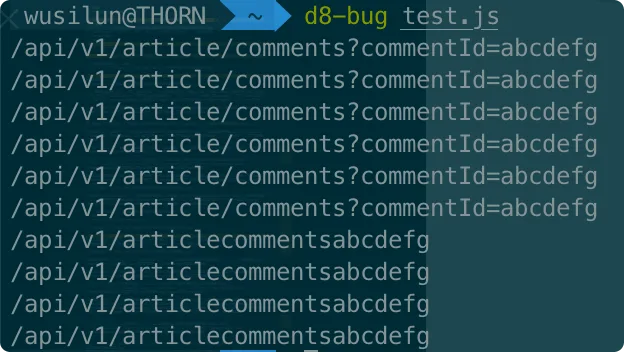
From the output you can see that, for the exact same logic, the 5001st and the 6001st repeated executions printed completely different content.
Beyond that, the further reading at the end of this article includes two analyses of TurboFan vulnerabilities from the Sangfor team, if you’re interested.
7. Orinoco and Garbage Collection
When memory is no longer needed, it’s reclaimed by the garbage collector, which runs periodically.
V8’s garbage collection has three main phases
- Marking: determine which objects are live/dead
- Sweeping: reclaim the memory occupied by dead objects
- Compaction: compact and tidy up fragmented memory
The Generational Hypothesis
The generational hypothesis, also known as the weak generational hypothesis, states that most newly created objects die soon after being allocated, while old objects tend to live on for the entire run of the program.
V8’s garbage collection is based on the generational hypothesis and splits memory into a young generation and an old generation.
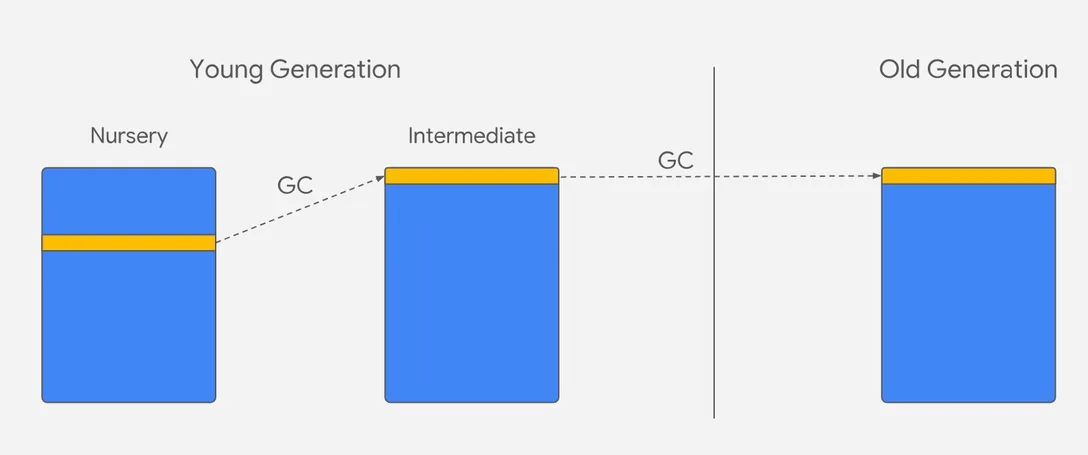 Image source - Trash talk: the Orinoco garbage collector
As shown in the figure, the young generation is further subdivided into the Nursery and Intermediate sub-generations (the split is purely logical). New objects are allocated in the young generation’s Nursery sub-generation. If an object survives its first garbage collection, its flag changes and it moves into the logical Intermediate sub-generation, while physically remaining in the young generation. If the object survives the next garbage collection too, it moves into the old generation. The process of moving from the young generation into the old generation is called promotion.
V8 applies different garbage-collection strategies in the young and old generations, making collection more targeted and more efficient. V8 also limits the memory size of both the young and old generations.
| Name | Main algorithm | Maximum capacity |
|---|---|---|
| Young generation | Scavenge | 2 * 16MB (64-bit) / 2 * 8MB (32-bit) |
| Old generation | Mark-sweep, mark-compact | 4096MB (64-bit) / 2048MB (32-bit) |
Note that as memory grows, garbage collections become less frequent, but each one takes longer, which hurts the application’s performance and responsiveness — so bigger memory isn’t automatically better.
The Young Generation
The young generation uses the Scavenge algorithm (a copying algorithm); its core idea is trading space for time.
V8 splits the young generation into two equally sized semispaces, called From space and To space. During garbage collection, V8 checks the live objects in From space and copies them to To space. Once all live objects have been moved to To space, V8 simply frees From space. After each copy completes, the positions of From and To space swap.
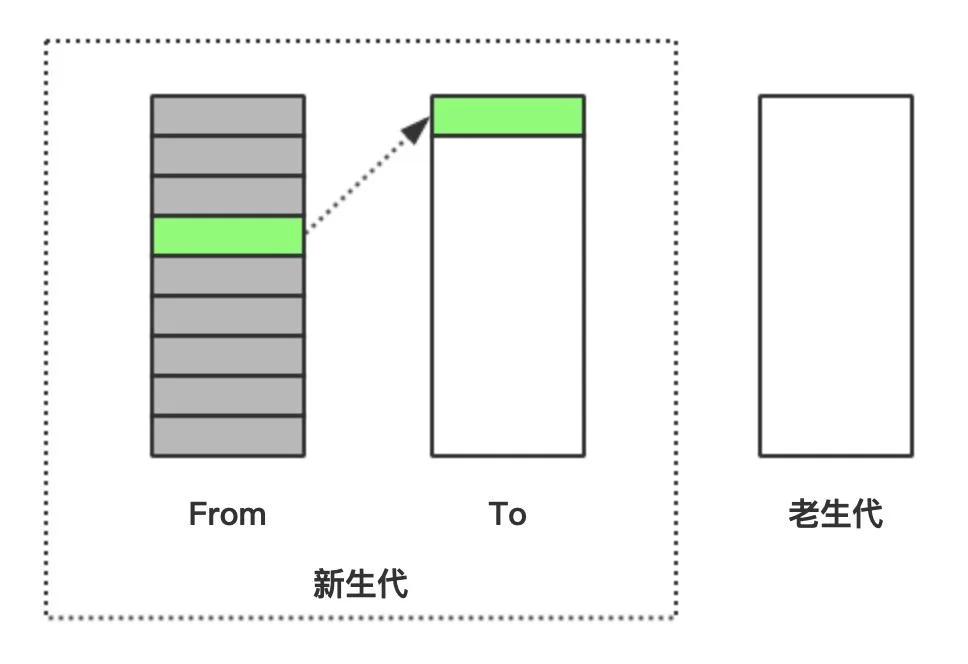
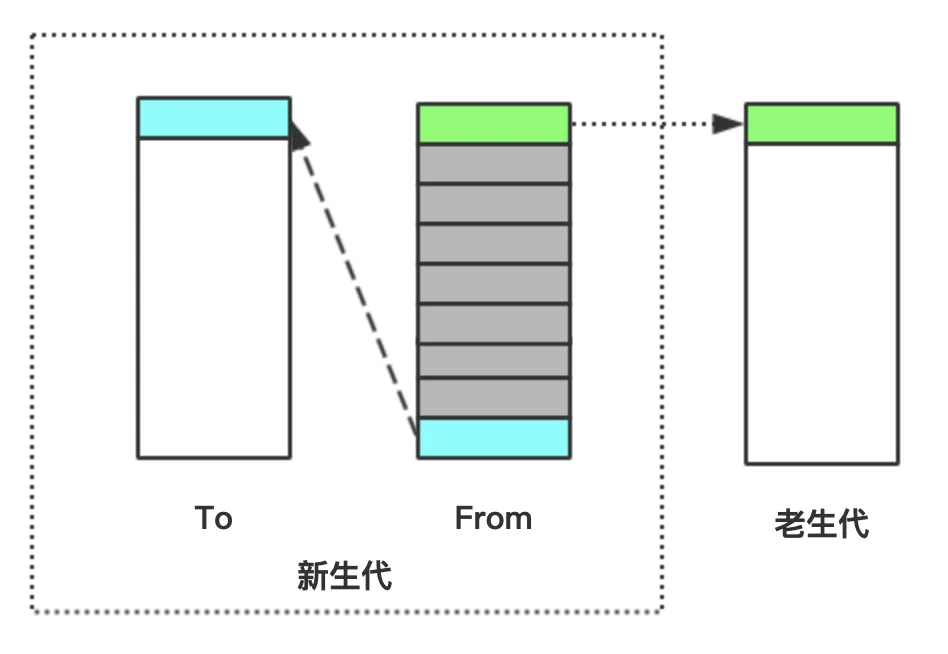
When an object is still alive after one copying cycle, it gets moved into the old generation — a process called promotion.
The Old Generation
According to the generational hypothesis, objects in the old generation tend to live for the entire lifetime of the program; that is, they rarely need to be collected. This means using a copying algorithm in the old generation would be inefficient. V8 uses mark-sweep and mark-compact algorithms for garbage collection in the old generation.
Mark-Sweep
The principle behind mark-sweep is very simple. The garbage collector starts from the root nodes, marks the objects directly referenced by the roots, and then recursively marks the objects those objects reference directly. An object’s reachability serves as the criterion for whether it’s “alive”.
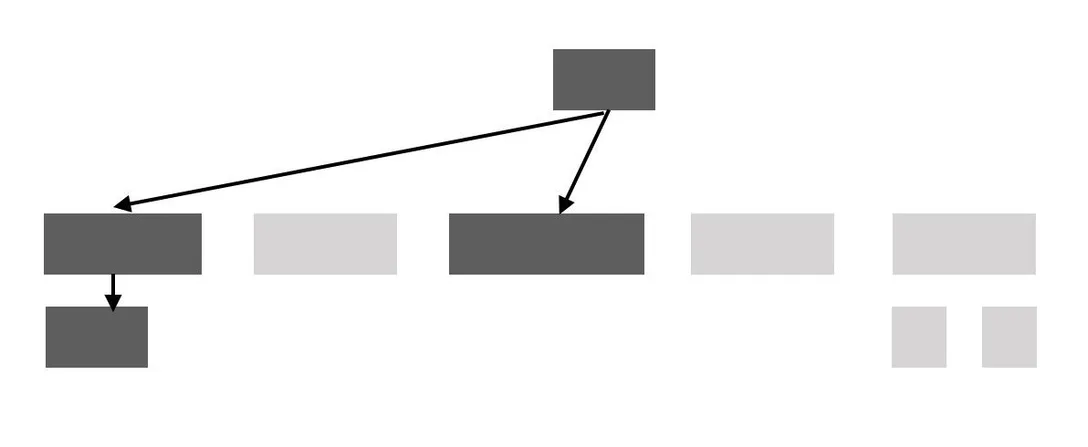
The time the mark-sweep algorithm takes is proportional to the number of live objects.
Mark-Compact
The mark-compact algorithm is a combination of the copying algorithm and the mark-sweep algorithm.
After we run mark-sweep, memory fragmentation can appear, and those fragments are bad for memory allocation in our programs.
To take an extreme example: in the figure below, the blue object is a new object we need to allocate memory for. Before compaction, none of the fragmented space (the lighter areas) can hold a complete object. After compaction, the fragmented space is merged into one large space that can accommodate this new object.
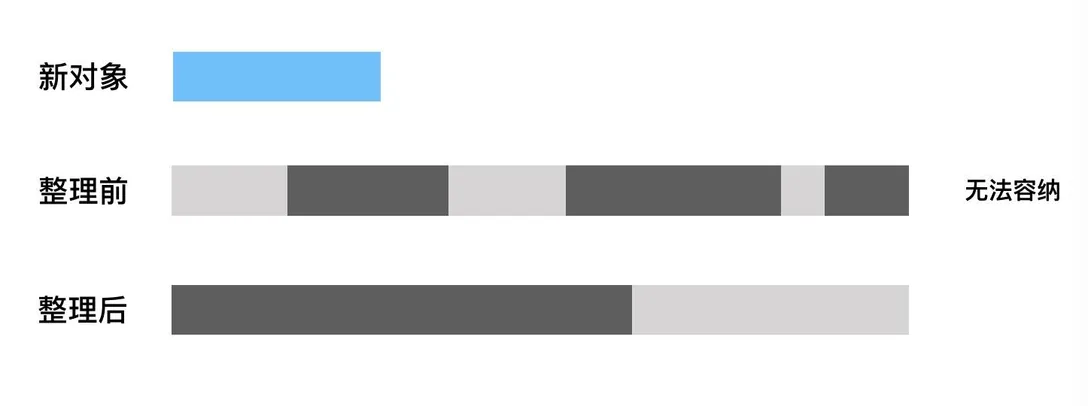
The mark-compact algorithm’s pros and cons are both striking. Its advantage is that it lets the heap be used more fully and effectively. Its disadvantages are that it requires extra scanning time and object-moving time, and the time it takes is proportional to the size of the heap.
On Marking
Images in this section are from Concurrent marking in V8
V8 uses tri-color marking to identify memory garbage. The three colors are distinguished by two flag bits: white (00), gray (10), and black (11).
Initially, all objects are white. Marking starts from the roots; as each node is visited, that node is turned gray.
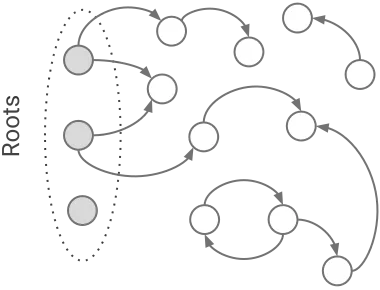
Once all of a gray node’s direct children have been visited, that gray node turns black.
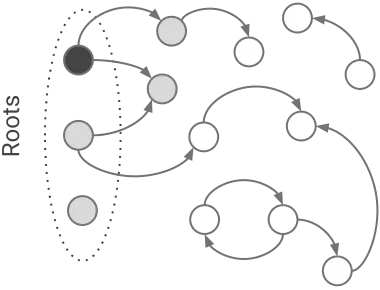
When there are no new gray nodes left, marking ends; the remaining white nodes are unreachable and can be safely reclaimed.
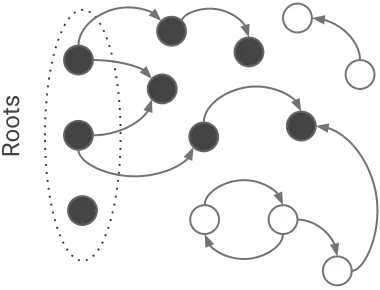
For performance reasons, V8 has made many optimizations to garbage collection as well (expanded on in the next section), which can result in new memory being allocated while garbage collection is running. To avoid memory-access conflicts, V8 implements a write barrier mechanism. The write barrier’s main working principle is to make sure black nodes cannot point to white nodes; if a child node is allocated under a black node, that child is forcibly turned from white to gray.
Optimization Strategies for Garbage Collection
Images in this section are from Trash talk: the Orinoco garbage collector
Running garbage collection inevitably pauses JavaScript execution. On the other hand, for a page to run smoothly, we usually want it to run at a frame rate of 60 frames per second — a rendering interval of about 16ms per frame. That means if garbage collection plus code execution takes more than 16ms, users will feel jank.
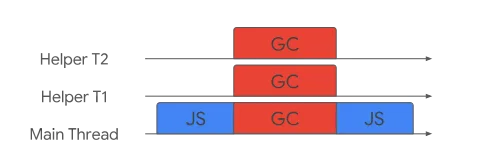
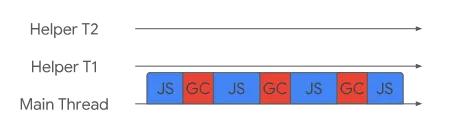
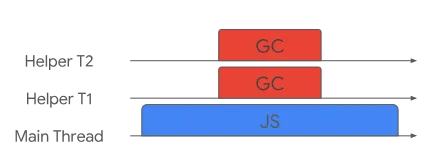
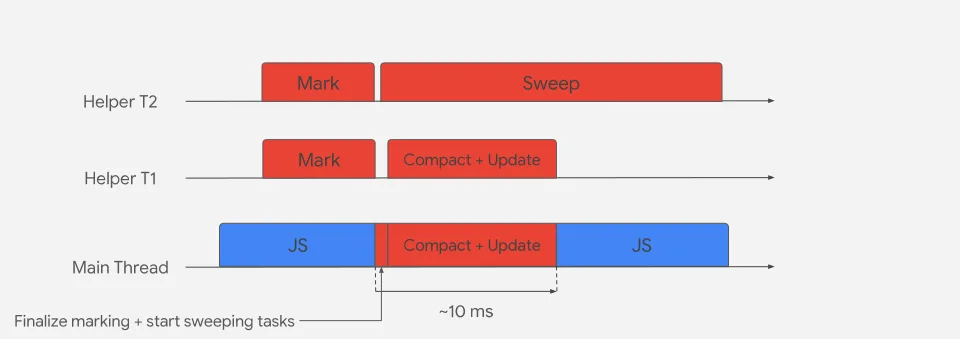
Orinoco uses parallel, incremental, and concurrent techniques for garbage collection to relieve pressure on the main thread, leaving it more time for normal JavaScript code execution.
Parallel means splitting garbage-collection work into several tasks of roughly equal size and running them simultaneously on the main thread and helper threads. Since no JavaScript runs during this, the implementation is fairly simple — you only need to ensure the threads stay in sync.
Incremental means the main thread breaks up what was originally a large, concentrated batch of garbage-collection work and runs it intermittently, in small pieces.
Concurrent means the main thread keeps executing JavaScript without interruption while helper threads run the garbage collection entirely in the background. Because it involves read/write races between the main thread and the helper threads, it’s the most complex of the three strategies.
In the young generation, V8 uses a parallel Scavenge algorithm.
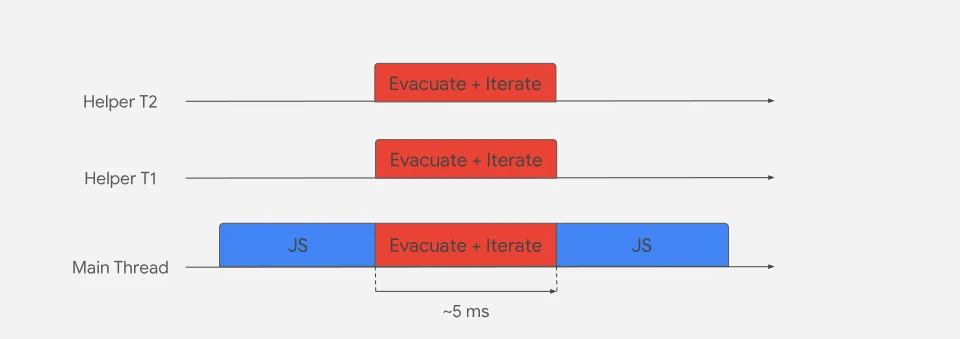
In the old generation, V8 uses concurrent marking, parallel compaction, and concurrent sweeping.
The article from two years ago also mentioned a calculation “error” in the community about the maximum reserved space; since relevant discussion is rarely seen these days and space here is limited, I won’t go over it again — check it out yourself if you’re interested.
8. Sparkplug, the Faster Non-Optimizing Compiler
Without enough type feedback, TurboFan can’t start optimizing early; and optimizing too early can mean optimizing code that isn’t hot, wasting resources. On the other hand, staying on Ignition’s bytecode forever means the code doesn’t execute efficiently. To solve this problem, V8 introduced the non-optimizing compiler Sparkplug in v9.1; it compiles bytecode directly into assembly code, without optimization.
Note that the “optimization” here revolves around one point — “whether speculation is driven by type feedback”. In fact, compared with Ignition bytecode, the assembly code Sparkplug generates is genuinely faster.
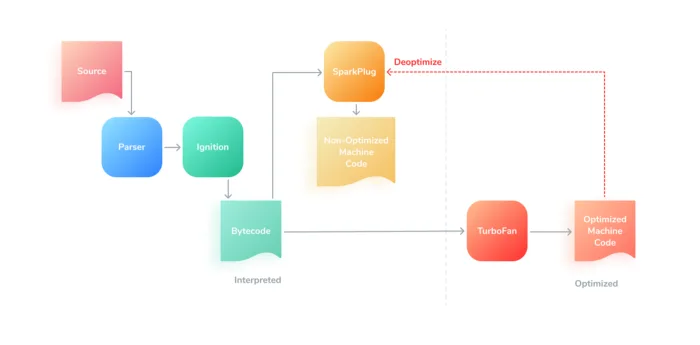 Image source - Sparkplug, the new lightning-fast V8 baseline JavaScript compiler
Sparkplug doesn’t generate any intermediate representation the way most compilers do; you can think of it as a “translator” from Ignition bytecode to CPU bytecode. Its compiler is a for loop nested with a switch statement, responsible for dispatching each bytecode to its own corresponding, fixed code-generation function.
Sparkplug maintains a stack frame compatible with the Ignition interpreter: whenever the interpreter stores a register value, Sparkplug stores it in sync as well, directly mirroring the interpreter’s behavior. This not only simplifies Sparkplug compilation and speeds it up, but also makes its integration with the rest of the system nearly free. It also makes OSR (On-Stack Replacement, a technique for swapping the stack frame of a running function) simple to implement.
Sparkplug’s design reuses existing mechanisms as much as possible (builtins, macro-assembly, stack frames) and keeps architecture-specific code to a minimum. Also, because Sparkplug is context-independent, its code can be cached and shared across pages.
On top of that, since Sparkplug applies the same type-feedback strategy as Ignition, the TurboFan-optimized code generated from it is equivalent.
9. Liftoff, the WebAssembly Baseline Compiler
Liftoff is the WebAssembly (hereafter WASM) baseline compiler, enabled in V8 v6.9 and supported on all platforms in V8 v8.5.
Liftoff’s goal is to reduce WASM application startup time by generating code as fast as it possibly can.
For a piece of WASM code, Liftoff iterates over the code only once, generating machine code for each WASM instruction immediately as it decodes and validates (combined with the Streaming API, WASM code can also, just like JavaScript code, be compiled as it downloads). Liftoff is very fast to run (about 10M per second) but leaves almost no room for optimization.
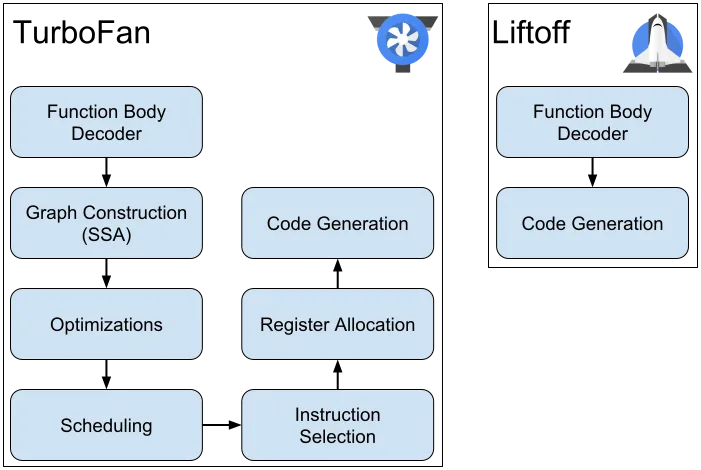 Image source - Liftoff: a new baseline compiler for WebAssembly in V8
As you can see from the figure above, Liftoff’s code generation doesn’t need to go through an IR, but at the same time it loses the possibility of optimization.
Since WASM is statically typed, it doesn’t need type feedback to generate optimized code. So once Liftoff finishes compiling, V8 recompiles all the functions with TurboFan. Because TurboFan applies compiler optimizations while compiling and uses a better register-allocation strategy, it can significantly speed up code execution.
Whenever a function finishes compiling in TurboFan, it immediately replaces the same function compiled by Liftoff. From then on, every call to that function will use the TurboFan-compiled code (unlike Sparkplug replacing Ignition, this process is not OSR). For large modules, V8 may need 30 seconds to 1 minute to compile the module fully.
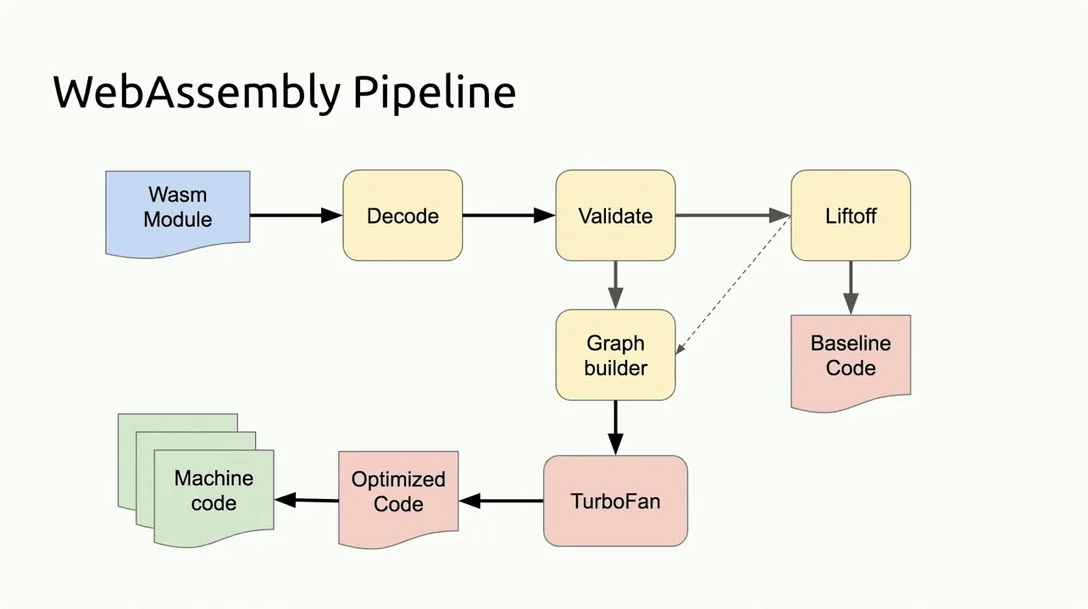 Image source - CovalenceConf 2019: Bytecode Adventures with WebAssembly and V8
If a WASM module is loaded with WebAssembly.compileStreaming, the machine code generated by TurboFan will be cached. When the same WASM module is fetched again from the same URL (the server needs to return 304 Not Modified), the module won’t be compiled — it will be loaded from the cache.
By the way, WASM modules in V8 can currently use up to 4GB of memory.
10. Code Caching
In the Chrome browser there are quite a few features that affect the JavaScript execution process to varying degrees, and one of them is code caching, which was enabled in V8 v6.6.
When the user visits the same page and the script files associated with that page haven’t changed at all, code caching makes loading and executing the JavaScript faster.
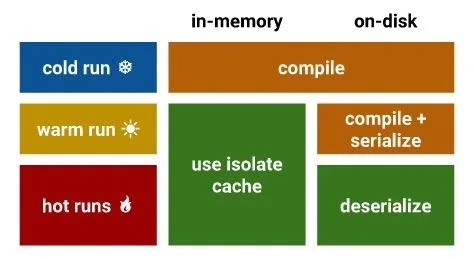 Image source: Code caching for JavaScript developers
Code caching is divided into three levels — cold, warm, and hot — stored in memory and on disk. The on-disk code cache is managed by Chrome, so that the cache can be shared across multiple V8 instances.
-
The first time the user requests a JS file (the cold run), Chrome downloads the file, hands it to V8 to compile, and caches the file itself on disk.
-
The second time the user requests the file (the warm run), Chrome fetches the file from the browser cache and hands it to V8 to compile again. After compilation finishes in the warm run, the compiled code is deserialized and attached to the cached script file as metadata.
-
The third time the user requests this JS file (the hot run), Chrome fetches both the file and the metadata from the cache and hands both to V8. V8 skips the compilation stage and deserializes the metadata directly.
Related Links
References
- Blazingly fast parsing, part 1: optimizing the scanner
- An Introduction to Speculative Optimization in V8
- Understanding V8’s Bytecode
- Ignition: Jump-starting an Interpreter for V8
- Sneak peek into Javascript V8 Engine
- Launching Ignition and TurboFan
- Celebrating 10 years of V8
- TurboFan: A new code generation architecture for V8
- TurboFan JIT Design
- Introduction to TurboFan
- A Tale Of TurboFan
- Sea of Nodes
- Deoptimization in V8
- A Brief Analysis of the V8 Engine’s TurboFan Backend
- Trash talk: the Orinoco garbage collector
- Sparkplug — a non-optimizing JavaScript compiler
- Sparkplug
- Mid-Tier Compiler Investigation
- Sparkplug, the new lightning-fast V8 baseline JavaScript compiler
- V8 release v7.4
- Liftoff: a new baseline compiler for WebAssembly in V8
- WebAssembly compilation pipeline
- Code caching for WebAssembly developers
- V8 release v6.6
- Code caching for JavaScript developers
- Concurrent marking in V8
Further Reading
- How V8 Runs — Object Representation in V8
- JavaScript Engine Fundamentals: Shapes and Inline Caches
- plctlab/v8-internals
- Chrome Browser Architecture, V8 Exploitation from 0 to 1
- The Chrome V8 Engine: From -1-Length Arrays to Remote Code Execution
- Ignition: Design Doc
- V8 TurboFan Register Allocation Design
- V8 / Chrome Architecture Reading List - For Vulnerability Researchers
Comments
Sign in with GitHub to leave a comment. View discussions on GitHub ↗